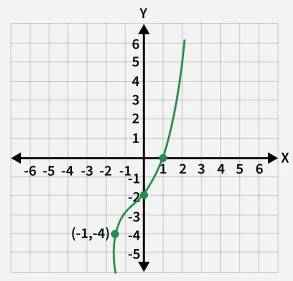
Graphing functions means drawing the graph of a mathematical function on the coordinate plane to show the relationship between the input values (x-values) and the output values (y-values).
Example 1: Determine which of the following points lie on the graph of the function f(x) = 2x3 - 2.
(a) (1, 1)
(b) (1, 0)
(c) (2, 6)
Solution:
We'll substitute each point in the given function to see which of them satisfies the function.
a)( 1, 1) = ( x, f( x))
1 = 2( 1) 3- 2
1 = 2- 2
1 = 0, not satisfied
So( 1, 1) is NOT on the graph of the function.
b)( 1, 0) = ( x, f( x))
0 = 2( 1) 3- 2
0 = 2- 2
0 = 0, satisfied
So( 1, 0) is on the graph of the function.
c)( 2, 6) = ( x, f( x))
6 = 2( 2) 3- 2
6 = 16- 2
6 = 14, not satisfied
So( 2, 6) is NOT on the graph of the function.
Answer: Only( b) lies on the given function.
Example 2: Does the graph given in illustration 1 have any asymptotes? Explain. How many branches does it have?
Solution:
The given function is f( x) = 2x3- 2, which is a polynomial function and hence it has no asymptotes.
When there are no asymptotes, we will get only one curve( as the curve does not break anywhere) while graphing functions.
Answer: No asymptotes and only one curve.
Example 3: Draw the graph of the function given in Example 1 along with the point(s) you set up from its result.
Solution:
In illustration 1, we have already found that( 1, 0) lies on the function f( x) = 2x3- 2. For graphing functions, we need further points. Let us construct a table for the same.
X
Y
-1
2(-1)3 - 2 = -4
0
2(0)3 - 2 = -2
Let us plot these points along with (1, 0) and plot it.
Answer: The graph is drawn.
Practice Questions
1. Draw the graph of the following functions:
f(x) = x − 2
f(x) = 9
f(x) = √x + 1
2. Graph the cosine function y = cos(x) for 0 ≤ x ≤ 2π
3. Plot the tangent function y = tan(x) over the interval −π/2 ≤ x ≤ π/2